
Project story
ARISTAS
Sales and marketing analytics
Business question
How are orders distributed across stores and ticket ranges?
Organize sales indicators and provide comparison views to explore the business.
Available evidence
Dashboards for sales, orders, customer service and average order value analysis.
What you can explore
The mix of orders by store and the share of each ticket range.
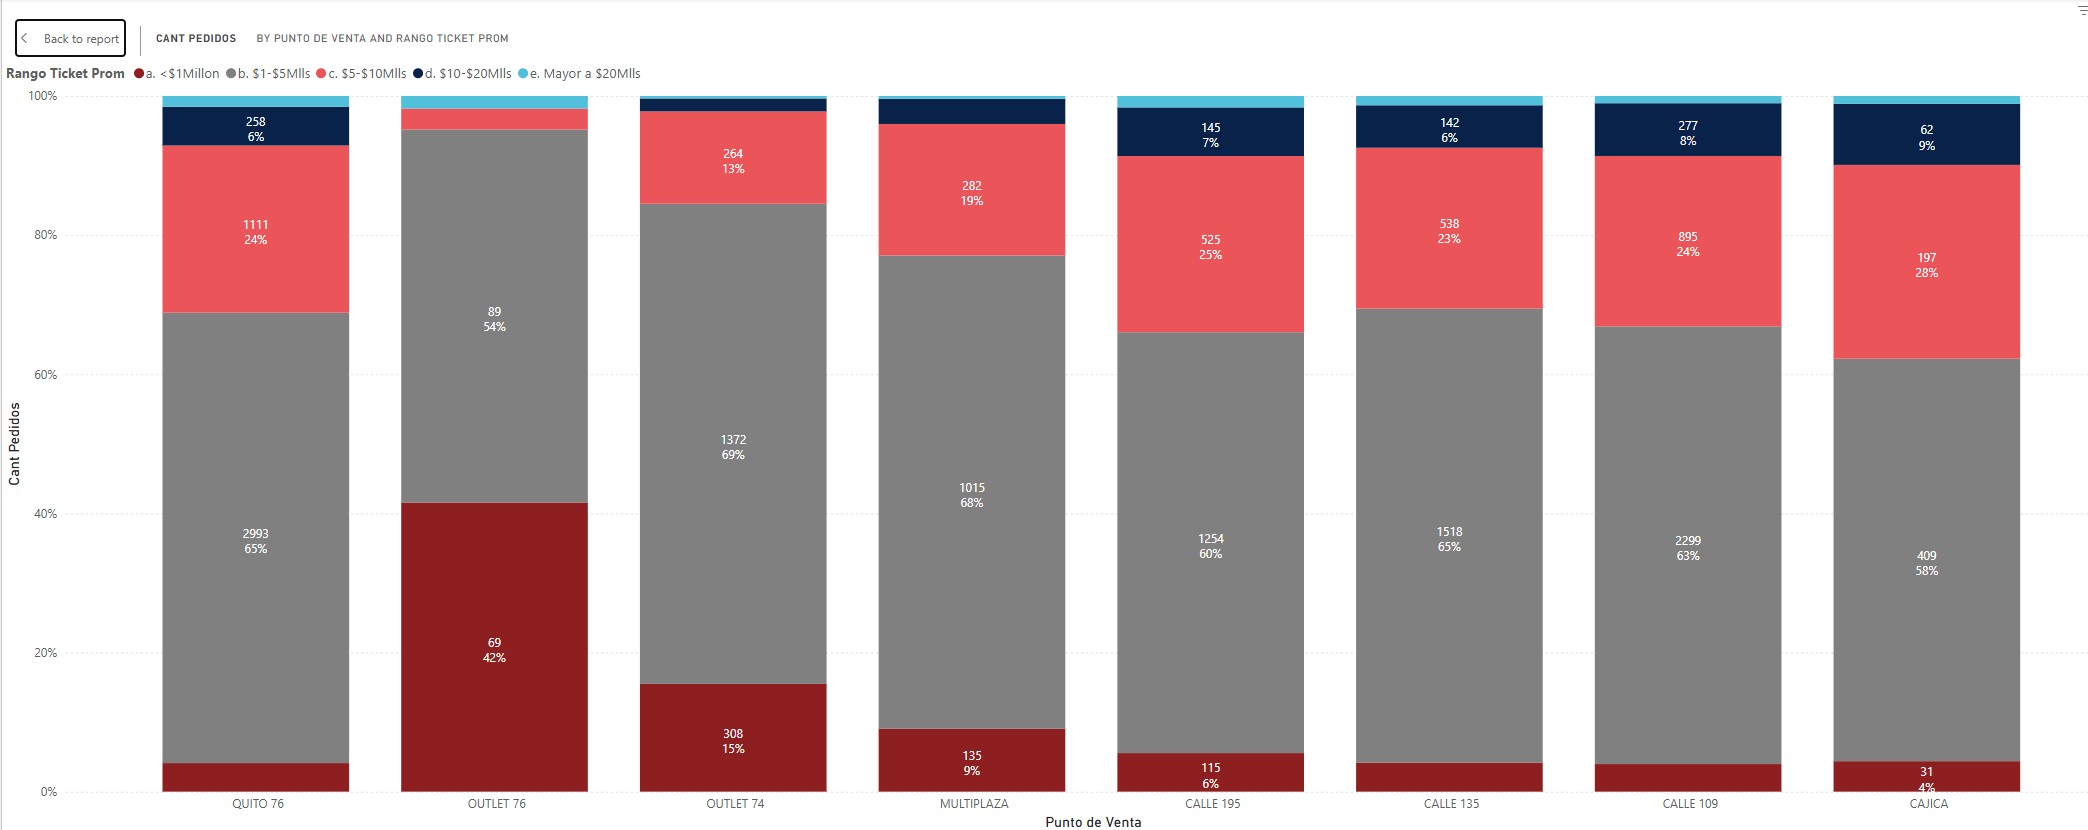
Actual screenshot from the archive. Historical values, not impact indicators.
Project profile for private review. Measurable results and the client reference require validation before publication.